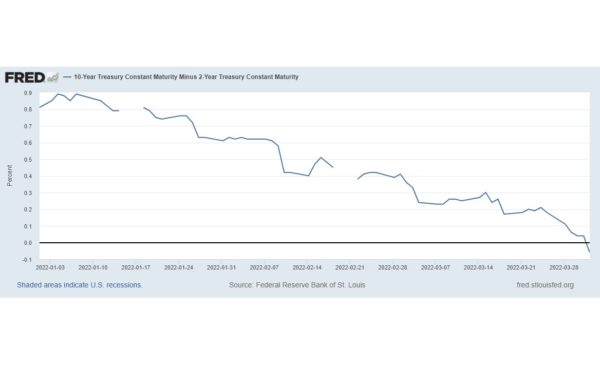
An inverted yield curve is an important economic indicator and is often a precursor to a recession. Normally, long-term interest rates are higher than short-term interest rates so a graphical plot of yields from Treasury bonds of different durations normally slopes up. One often-used graphic is the 10-Year Treasury minus the 2-Year Treasury. If the result is less than zero, an inverted yield curve has occurred.

On Friday, April 1, a strong unemployment report resulted in an inversion and discussion on whether a recession will eventually result. Since 1955, equities have peaked six times after the start of an inversion, and the economy has fallen into recession within 7-24 months thereafter. More recently, an inverted yield curve appeared in August 2006 as the Federal Reserve raised short-term interest rates in response to overheating equity, real estate and mortgage markets. The inversion of the yield curve preceded the peak of the Standard & Poor’s 500 in October 2007 by 14 months and the official start of the recession in December 2007 by 16 months.
In 2019, the yield curve again inverted, worrying economists about another downturn. In early 2020, the COVID-19 pandemic did, in fact, trigger a global recession; however, no economists think that the yield curve was able to predict the pandemic and the COVID-19 downturn quickly rebounded to new record highs into 2022.
If history is any precedent, the current business cycle will progress and slowing in the economy may eventually become evident, resulting in a recession.
